
Deriv Minimum Deposit: Amounts & Payment Methods
Understanding Deriv Charts: Tools & Tips
Nigerian traders exploring synthetic indices, forex, and binary options on Deriv rely heavily on chart tools to time their entries and exits. This guide walks through the main chart types, how to set up a chart view that works for your strategy, and practical reading tips for anyone trading from Nigeria. If you want to see the charts in action, you can open a Deriv account and follow along on a demo first.
What Are Deriv Charts And Why They Matter
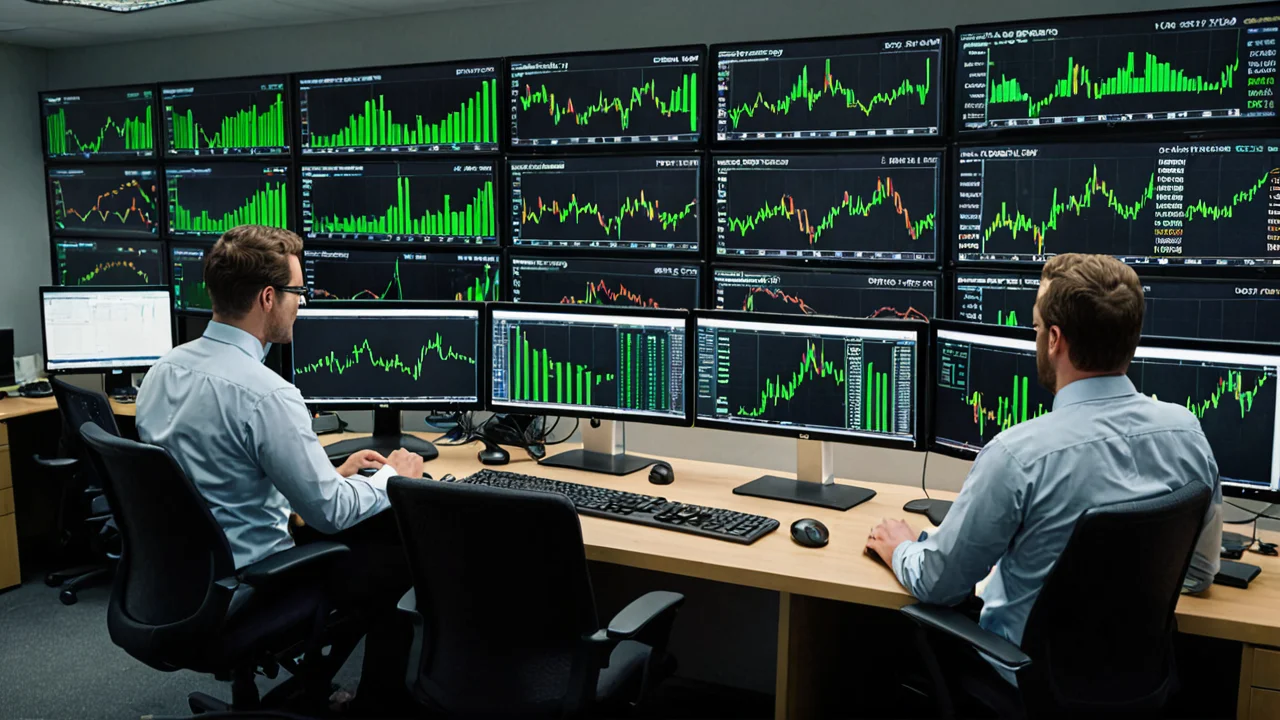
A chart on Deriv is simply a visual record of price movement over time for whichever instrument you have selected, whether that's a synthetic index, a forex pair, or a commodity CFD. For Nigerian traders, charts are the main decision-making tool because Deriv's proprietary platforms are built around fast-moving price action, especially on synthetic indices that trade around the clock.
Reading a chart well matters more on Deriv than on some other brokers because synthetic indices don't move in response to news events the way forex or stocks do. Price behavior on these instruments is generated continuously, so pattern recognition and indicator use become the primary tools traders have, rather than fundamental analysis.
- Charts update in real time as price ticks come in
- Different instruments (forex, synthetic indices, commodities) each have their own chart
- You can switch between chart styles without leaving the trade screen
- Charts work the same whether you're on a demo account or a funded real account
Key Takeaway: On Deriv, chart reading skill matters as much as strategy, since synthetic indices don't follow news-driven fundamentals the way traditional markets do.
Types Of Charts Available On Deriv
Deriv's platforms typically offer a few standard chart formats that traders switch between depending on what they're analyzing. Each format presents the same price data differently, and picking the right one depends on your trading style.
Line charts are the simplest option, connecting closing prices with a single line. They're useful for a quick, uncluttered view of the overall trend, especially if you're new to reading price data and want to avoid getting distracted by noise.
Candlestick charts are the most widely used format among active traders because each candle shows the open, high, low, and close for a given time period. This makes it easier to spot momentum shifts, reversals, and consolidation patterns at a glance.
Some Deriv chart views also include area charts, which shade the space beneath the line to emphasize the magnitude of price swings. This can help when you're scanning multiple synthetic indices quickly and want a visual sense of volatility without reading every candle.
- Line chart: clean trend view, good for beginners
- Candlestick chart: detailed price action, preferred by most active traders
- Area chart: quick visual read on volatility across instruments
Key Takeaway: Candlestick charts tend to give Nigerian traders the most useful detail for timing entries, while line charts work well for a fast trend check.
Get verified tools
RSI, MACD, MAs — all in the platform.
How To Set Up A Deriv Chart View For Trading
Setting up your chart view properly before you start trading saves time and reduces mistakes. On Deriv's platforms, you generally choose your instrument first, then pick a timeframe, then layer on any indicators you want to use.
Timeframes range from very short intervals suited to quick trades on synthetic indices, up to longer periods better suited for forex or CFD swing positions. Because synthetic indices run continuously, including weekends, Nigerian traders sometimes use shorter timeframes on these instruments and longer ones on forex pairs, where price behavior is tied to global trading sessions.
It helps to keep your chart view simple at first. Loading too many indicators onto one chart can make it harder to read, not easier.
- Select your instrument (forex pair, synthetic index, or commodity)
- Choose a timeframe that matches your trading style
- Add one or two indicators rather than stacking many at once
- Save your preferred layout if the platform allows it, so you don't rebuild it every session
Key Takeaway: A clean chart setup with a clear timeframe and minimal indicators is easier to trade from than a cluttered one.
Reading Chart Patterns On Synthetic Indices
Synthetic indices behave differently from forex or stock charts because their price movement isn't driven by economic data releases or company earnings. Instead, the patterns you'll observe are generated by the underlying model behind each index, which means classic technical analysis concepts like support, resistance, and trend lines still apply, but news-based catalysts don't.
This is one reason many Nigerian traders find synthetic indices appealing for chart-based strategies. Since there's no unexpected news to cause sudden gaps, some traders feel patterns play out more predictably on a chart.
That said, volatility on synthetic indices can still be sharp, and reading a chart correctly means paying attention to how quickly price is moving, not just its direction. A chart that looks calm on one timeframe can look very different zoomed into a shorter interval.
- Support and resistance levels remain relevant on synthetic index charts
- No news-driven gaps, since these instruments aren't tied to economic events
- Volatility can still spike, so timeframe choice affects how "smooth" a chart appears
- 24/7 availability means charts keep updating even on weekends, unlike forex
Key Takeaway: Synthetic index charts follow technical patterns closely because there's no news noise, but traders should still respect volatility shown across different timeframes.
Better local methods on Stockity
Faster withdrawals than offshore alternatives.
Using Deriv Charts For Forex And CFD Trading
Forex and commodity CFDs on Deriv behave more like charts you'd see with any traditional broker, since price is influenced by real-world events, interest rate expectations, and session-based liquidity. Nigerian traders using Deriv for forex often watch the chart around major session overlaps, when price activity tends to pick up.
Reading a forex chart on Deriv means paying attention to how price reacts near round numbers, previous highs and lows, and any consolidation zones that appear before a session opens. Because forex charts reflect global market behavior rather than a continuous synthetic model, patterns can break down suddenly around news events, so traders often widen their stop levels or reduce position size around known announcement times.
- Forex charts follow standard session-based liquidity patterns
- Commodity CFD charts often show clearer trends during active trading hours
- Chart behavior on these instruments can shift quickly around news events
- Comparing forex charts side by side with synthetic index charts highlights the difference in volatility style
Key Takeaway: Forex and CFD charts on Deriv require more awareness of news timing than synthetic index charts do.
Common Mistakes Nigerian Traders Make With Deriv Charts
A common mistake is switching timeframes too often mid-trade, which can create confusion about what the "real" trend actually is. Sticking to one timeframe for entries and a longer one for context tends to produce more consistent decisions.
Another frequent issue is overloading a single chart with too many indicators, which can make simple price action harder to see rather than easier. Simpler chart setups are usually easier to act on quickly, especially for short-term trades on synthetic indices.
Some traders also forget to check whether they're viewing a demo chart or a real account chart, particularly when testing new strategies. Since Deriv supports switching between demo and real accounts, it's worth double-checking which one is active before placing a trade based on what the chart shows.
- Avoid switching timeframes repeatedly during a single trade
- Don't stack more indicators than you can actually interpret
- Confirm whether you're viewing demo or real account data
- Take time to practice reading charts on a demo account before funding a real one
Key Takeaway: Simplicity and consistency in chart setup usually beat complexity when trading on Deriv.
Getting Started With Deriv Charts In Nigeria
For Nigerian traders new to Deriv, the most practical starting point is opening a demo account and spending time simply watching how charts move across different instruments before risking real funds. This gives you a feel for how synthetic indices differ from forex charts without any financial pressure.
Deriv's minimum deposit for a real account starts low, which makes it accessible for traders in Nigeria who want to move from demo to live trading without committing a large sum upfront. Deposit methods commonly used by Nigerian traders include cards and e-wallets such as Perfect Money, giving reasonable flexibility for funding an account once you're ready.
Once you've opened an account, spend time comparing chart types side by side rather than jumping straight into live trades. A short period of observation, even just watching how candlestick patterns form on a synthetic index versus a forex pair, tends to build more useful intuition than reading theory alone.
You can review the deriv platform's chart tools firsthand by creating a demo account, which requires no deposit and lets you test chart views at your own pace.
Frequently Asked Questions
-
What chart types are available on Deriv?
A: Deriv's platforms typically offer line, candlestick, and area chart formats, letting traders pick the style that best suits their analysis, whether it's a quick trend check or detailed price action reading.
-
Are Deriv charts different for synthetic indices compared to forex?
A: Yes. Synthetic index charts reflect continuous, model-generated price movement without news-driven gaps, while forex and CFD charts respond to real-world market events and session-based liquidity.
-
Can I practice reading Deriv charts without risking money?
A: Yes, Deriv supports demo accounts alongside real accounts, so Nigerian traders can study chart behavior and test strategies before funding a live account.
-
Do Deriv charts work the same on mobile as on desktop?
A: Deriv's charting tools are designed to function across its web and mobile platforms, so the core chart types and timeframe options remain accessible whether you're trading from a phone or a computer.
-
How do I choose the right timeframe for a Deriv chart?
A: It depends on your instrument and strategy. Shorter timeframes suit quick trades on synthetic indices, while longer timeframes are often better for forex or CFD positions influenced by broader market sessions.