
5-Minute RSI Scalping Strategy on Deriv for Beginners
Advanced Deriv Charting Tools You Should Know
Reading price movement well matters as much as picking the right asset, and this is where charting tools come in. Nigerian traders using deriv get access to a proprietary charting environment built for both forex/CFD analysis and synthetic indices, which trade around the clock. This guide walks through what an advanced Deriv chart-chart-guide/) offers, how the Deriv chart view is structured, and how to use it to read the market more confidently.
Understanding The Deriv Chart Interface
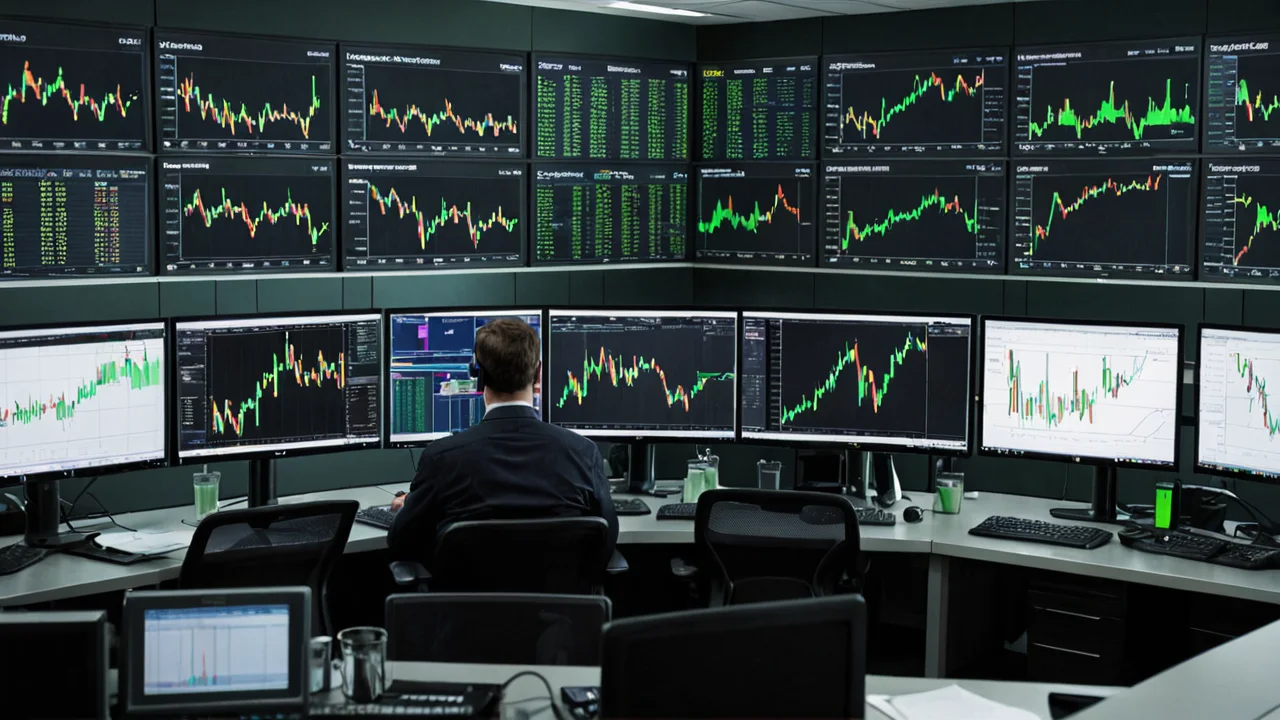
The Deriv chart view is built into the platform's own trading interface rather than requiring a separate download, which makes it accessible from a browser or mobile app for most Nigerian users. Traders coming from other platforms will notice that price is displayed alongside timeframe selectors, drawing tools, and indicator menus in a single unified screen.
This setup matters for anyone trading synthetic indices, since these instruments run continuously, including weekends, and price action never fully pauses. A trader watching a synthetic index chart late on a Saturday night in Lagos can still see live candles forming, something that isn't possible with standard forex pairs when markets are closed.
- Multiple timeframe views from short intraday charts to longer-term price history
- Candlestick, line, and other common chart display styles
- A workspace that stays consistent whether you're analyzing forex, CFDs, or synthetic indices
Key Takeaway: Deriv charts work the same way across asset classes, so learning the interface once carries over to every market you trade on the platform.
Chart Types And Display Styles
Choosing how price is displayed affects how quickly patterns become visible. Deriv's charting tools typically support several common display formats, letting traders switch between a clean line chart for spotting overall trend direction and candlestick views for reading more granular price behavior.
Nigerian traders analyzing binary options contracts often prefer candlestick displays because they show open, high, low, and close data at a glance, which helps when timing short-duration trades. Those trading multipliers or CFDs over longer periods may lean toward broader chart views that emphasize trend structure rather than tick-by-tick movement.
Switching between display types inside the same chart window means you don't lose your indicator setup or drawing work when experimenting with a different visual style. This flexibility is useful for traders who like to confirm a signal using more than one way of viewing the same price data.
Indicators Available On Deriv Charts
Technical indicators are central to how most Nigerian traders approach the Deriv chart, whether they're trading synthetic indices, forex pairs, or binary contracts. The platform's charting tools include a menu of indicators that can be layered directly onto the price chart or displayed in a separate panel below it.
Common categories traders use include trend-following tools, momentum indicators, and volatility measures. Because synthetic indices are designed to simulate consistent volatility patterns, some Nigerian traders specifically lean on volatility-based indicators when analyzing these instruments, while forex and CFD traders often combine trend and momentum tools to confirm entries.
- Trend indicators to identify overall market direction
- Momentum tools to gauge strength or weakness in a move
- Volatility-based indicators, useful for synthetic index analysis
It's worth experimenting with indicator combinations on a demo account first. Deriv supports both demo and real accounts, and switching between them is straightforward, which gives Nigerian beginners room to test a charting strategy without financial risk before applying it live.
Key Takeaway: Combining two or three complementary indicators, rather than crowding the chart, tends to produce clearer signals for most traders.
Drawing Tools For Manual Analysis
Beyond built-in indicators, the advanced Deriv chart includes manual drawing tools that let traders mark up price action based on their own analysis. Trend lines, horizontal support and resistance markers, and other annotation tools are standard features within the charting workspace.
This matters particularly for Nigerian traders who follow price action strategies rather than relying solely on automated indicators. Drawing a trend line across recent highs or lows on a synthetic index chart, for example, can help visualize where price might react even though these instruments don't move based on traditional market news or economic data releases.
Annotations save within your session, so returning to a chart later doesn't mean starting your analysis from scratch. This is useful for traders who track a handful of instruments consistently and want to build on prior observations rather than repeating the same setup every time they log in.
Applying Deriv Charts To Different Instruments
How you use the chart tends to shift depending on what you're trading. Nigerian users active in binary options often zoom into shorter timeframes since contract durations are typically brief, meaning fast-reacting indicators and clean candlestick reading become priorities.
Traders working with forex and commodity CFDs, meanwhile, may use longer timeframes to catch broader trends, layering trend indicators over daily or multi-hour views. Since Deriv also offers access to synthetic indices, some traders maintain separate chart setups entirely, one tuned for real-world markets and another built around the steadier, continuous behavior of synthetic instruments.
- Short timeframes and fast indicators for binary options timing
- Longer timeframes and trend tools for forex/CFD positioning
- Dedicated setups for synthetic indices given their 24/7 availability
Key Takeaway: There's no single "correct" chart setup. What works depends heavily on which instrument and trading style you're focused on.
Practical Tips For Nigerian Traders Using Deriv Charts
Getting comfortable with Deriv's charting tools takes a bit of deliberate practice, especially for newer traders. Starting on a demo account lets you test different indicator combinations and drawing techniques without financial exposure, which is particularly valuable given how many display and analysis options are packed into the platform.
Since Deriv is available to Nigerian traders and account funding can be done through methods like cards and e-wallets, it's worth spending time on the charting side of the platform before committing real capital. A minimum deposit starting from a low threshold means testing live conditions doesn't require a large upfront commitment, but chart familiarity still matters more than deposit size when it comes to decision-making quality.
Keep your workspace simple at first. Many experienced Deriv users say overcomplicating a chart with too many indicators actually slows down decision-making rather than improving it. Build up gradually, and revisit your setup periodically as your trading style evolves.
Frequently Asked Questions
-
Do I need to download separate software to access advanced Deriv chart tools?
A: No. The Deriv chart view is built directly into the platform's web and mobile interface, so there's no need for a separate charting application.
-
Can Nigerian traders use Deriv charts for synthetic indices as well as forex?
A: Yes. The same charting tools apply across synthetic indices, forex, CFDs, and binary options, giving Nigerian traders one consistent workspace across instruments.
-
Is it possible to practice with Deriv charts before trading with real money?
A: Yes. Deriv supports demo accounts alongside real accounts, and switching between the two is simple, which makes it practical to test chart-based strategies risk-free first.
-
Are indicators customizable on Deriv charts?
A: Deriv's charting tools include a range of trend, momentum, and volatility indicators that can be applied and layered onto the chart, letting traders build setups suited to their own strategy.
-
Do synthetic index charts behave differently from forex charts on Deriv?
A: Synthetic indices trade continuously, including weekends, so their charts keep updating even when traditional forex markets are closed, which is worth factoring into how you plan your analysis sessions.