
Deriv Withdrawal in Nigeria
How to Use the Deriv Chart View Like a Pro
Reading a price chart is the first real skill any Nigerian trader needs before touching synthetic indices, forex or binary contracts on Deriv. This guide walks through the chart view interface, how to customize it, and the small settings that make a big difference once you Open Deriv Account → and start trading live.
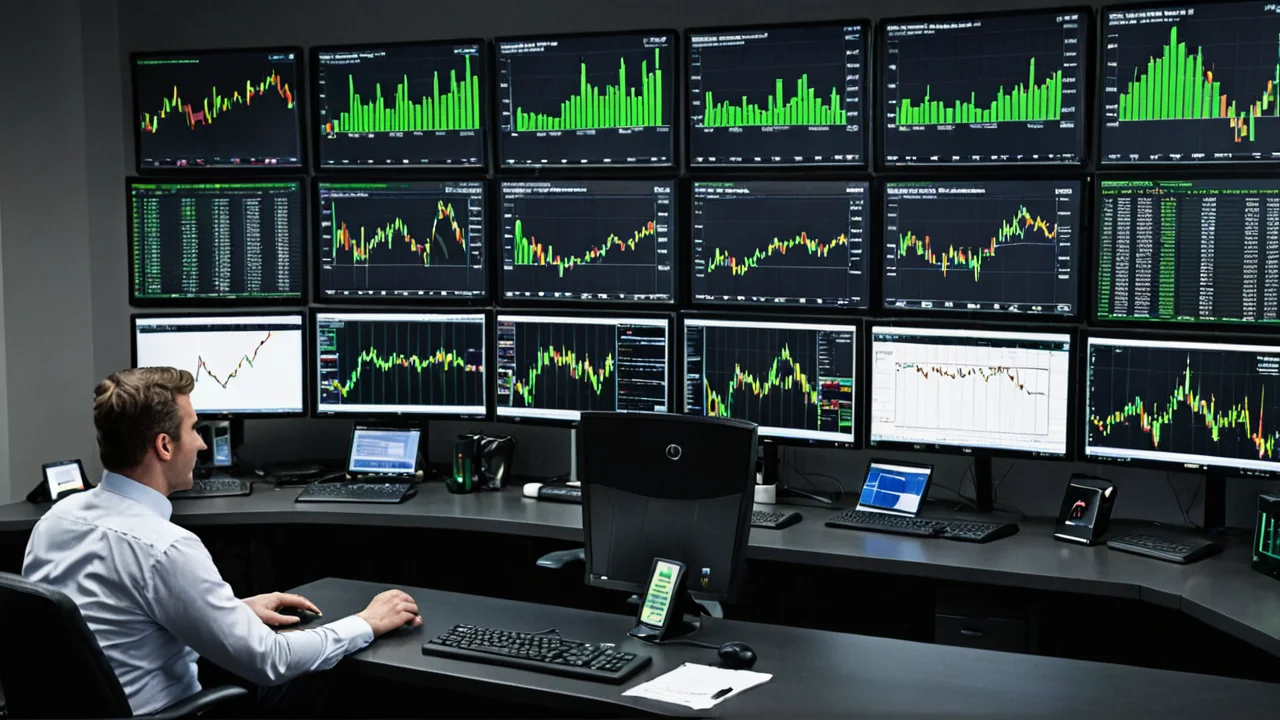

What The Deriv Chart View Actually Shows
The chart view is the main workspace on Deriv's proprietary trading platform, the screen where price movement for synthetic indices, forex pairs and other instruments is plotted in real time. It sits at the center of both the web platform and mobile app, and everything else, trade tickets, contract types, account switching, is arranged around it.
For Nigerian users coming from Binary.com or new to Deriv entirely, the chart is where you decide when to enter a binary contract or multiplier position. Since synthetic indices trade 24/7, including weekends, the chart never fully "closes" the way a typical forex session does, which matters if you're used to markets that pause on Saturdays.
- Price action displayed as candlesticks, lines, or area charts
- A live price ticker updating continuously for synthetic indices
- Tools to add indicators, draw trendlines and adjust timeframes
- A demo/real account toggle that lets you test settings without risking funds
Key Takeaway: the chart view is not just a display, it's the control panel for every trade decision you make on Deriv, so learning its layout early saves confusion later.
Switching Between Chart Types
Deriv's platform typically offers a few different ways to visualize the same price data, and picking the right one depends on what kind of trader you are.
Candlestick charts remain the most popular choice among Nigerian traders because they compress open, high, low and close data into a single visual block, making it easier to spot momentum shifts. Line charts strip everything down to just closing prices, which some beginners prefer because there's less visual noise. Area charts sit somewhere in between, useful mainly for a quick glance at overall trend direction.
Most experienced traders on synthetic indices stick with candlesticks because the wicks reveal volatility spikes that a plain line chart would hide completely.
- Candlestick view: best for spotting reversals and volatility
- Line chart: cleaner, good for beginners tracking simple trend direction
- Area chart: quick visual read, less common for active trading
Switching between these views usually takes one click from a toolbar icon near the top of the chart panel, so there's no reason to stick with a format that doesn't suit your strategy.
Customizing Timeframes On The Chart
Timeframe selection changes how much price history is compressed into each candle or point on the chart, and this is one of the first things Nigerian traders should adjust before placing a binary contract.
Shorter timeframes show more granular price movement, useful for very short-duration binary options where entries and exits happen within minutes or even seconds. Longer timeframes smooth out the noise and are better suited to spotting broader trend direction before deciding on a multiplier position or a longer synthetic index trade.
A common mistake among new users is trading a short binary contract while looking at a chart set to a much longer timeframe, which creates a mismatch between what you see and what you're actually trading. Matching your chart timeframe to your contract duration is a simple habit that improves decision quality almost immediately.
Key Takeaway: always align your chart's timeframe with the actual duration of the contract or trade you're about to open.
Adding Indicators And Drawing Tools
Beyond raw price display, the Deriv chart view supports layering technical indicators and drawing tools directly on top of the price action.
Common additions include moving averages, oscillators, and volatility bands, all of which help traders read momentum or identify potential entry zones on synthetic indices. Drawing tools like trendlines, horizontal support/resistance markers, and Fibonacci-style overlays let you annotate the chart manually based on your own analysis rather than relying only on built-in indicators.
Because synthetic indices are proprietary instruments designed to mimic market volatility, some traders in Nigeria specifically favor volatility-based indicators when analyzing them, since these instruments don't follow traditional market hours or news-driven price gaps the way forex pairs do.
- Moving averages for trend direction
- Oscillators for overbought/oversold signals
- Manual trendlines and horizontal levels for support/resistance
- Volatility bands, useful specifically for synthetic index behavior
Keep the chart uncluttered. Loading too many indicators at once often makes the price action harder to read, not easier.
Using The Demo Account To Practice Chart Reading
Deriv supports both demo and real accounts, and switching between them is straightforward from within the platform. This matters a lot for Nigerian beginners who want to get comfortable with the chart view before committing real money.
A demo account gives you the exact same chart interface, same indicators, same drawing tools, just with virtual funds instead of real capital. Spend time here adjusting timeframes, testing different chart types, and getting a feel for how synthetic indices move differently from forex CFDs before switching to a live account.
This practice step is often skipped, and it's usually the reason new traders misread their first few live charts.
Once you're comfortable identifying trend direction, support and resistance zones, and volatility patterns on the demo chart, moving to a real account with a low minimum deposit becomes a much smaller leap.
Mobile Vs Desktop Chart View Differences
Nigerian traders frequently switch between desktop browsers and mobile apps depending on where they are, and the chart view adapts slightly across these formats.
On desktop, you typically get a larger workspace with more indicators visible simultaneously and easier access to drawing tools via a sidebar. On mobile, the chart is optimized for touch, with simplified menus for switching timeframes and adding indicators, though the core price data remains identical across both platforms.
If you're managing trades on the go, which is common given how mobile data usage works across Nigeria, it helps to set your preferred indicators and timeframe once, since most settings carry over between sessions on the same account.
- Desktop: larger view, more simultaneous indicators, easier multitasking
- Mobile: touch-optimized, simplified menus, same underlying price data
- Settings often persist across devices when logged into the same account
Key Takeaway: whichever device you use, the underlying chart data is identical, only the layout and interaction style change.
Common Chart View Mistakes To Avoid
A few recurring mistakes show up repeatedly among Nigerian traders new to Deriv's chart interface, and avoiding them early saves both money and frustration.
Overloading the chart with too many indicators is probably the most common one. When five or six indicators are stacked on the same chart, conflicting signals make decision-making harder rather than easier. A simpler setup, one or two indicators plus clean price action, usually reads better in practice.
Another mistake is ignoring the timeframe mismatch mentioned earlier, trading short binary contracts while viewing long-term charts. Related to this is failing to use the demo account long enough before switching to real funds, which means chart-reading habits get tested with real money instead of virtual capital first.
- Overloading the chart with too many conflicting indicators
- Trading short contracts while viewing long timeframes
- Skipping demo practice before using real funds
- Never adjusting default settings to match your own trading style
Fixing these habits doesn't require advanced knowledge, just a bit of discipline in how you set up the chart before each session.
Frequently Asked Questions
-
Do I need a real account to access the full Deriv chart view?
A: No. Deriv supports demo accounts with the same chart interface, indicators and drawing tools as a real account, so you can practice reading charts before depositing funds.
-
Can I use the Deriv chart view on mobile in Nigeria?
A: Yes, the chart view is available on both desktop and mobile formats, with the same underlying price data, though the mobile layout is simplified for touch navigation.
-
Why do synthetic index charts on Deriv move even on weekends?
A: Synthetic indices are proprietary instruments designed to simulate market volatility continuously, so their charts remain active 24/7, unlike traditional forex charts that pause outside market hours.
-
What's the best chart type for beginners in Nigeria?
A: Candlestick charts are the most widely used because they show open, high, low and close prices in one view, which makes momentum and reversals easier to spot than a plain line chart.
-
Does adding more indicators improve chart reading accuracy?
A: Not necessarily. Loading too many indicators at once often creates conflicting signals, and most experienced traders keep their chart setup simple with just one or two well-understood indicators.